Build a Dashboard
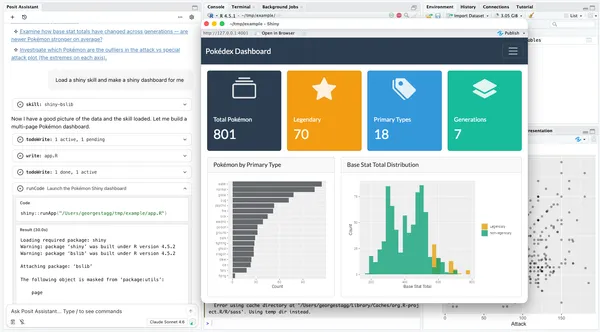
Posit Assistant can help you build a dashboard application in one conversation. You describe what you want to see in plain language, and Posit Assistant makes the layout, connects the inputs, and writes the code.
You can build:
- Multi-panel analytics dashboards: Distributions, scatter plots, heatmaps, and summary cards in one view
- Interactive data explorers: Dropdowns, sliders, and filters that update charts in real time
- Monitoring dashboards: Metrics over time from your data sources
This guide walks you through using Posit Assistant to build a dashboard. By the end of this guide, you will have:
- A working dashboard application with inputs and interactive plots
- A layout and style that you refined in follow-up messages
- A dashboard that is ready to deploy to Posit Connect or Posit Connect Cloud
Prerequisites
- Posit Assistant installed with a model provider connected
- The data for your dashboard, in your project or in your session
- For an R Shiny dashboard, the
shinyandbslibpackages installed - For a Quarto dashboard, Quarto installed
- For a Python dashboard, the
shinyorstreamlitPython package installed
Posit Assistant uses built-in skills for dashboards. When you ask for a dashboard, it loads the shiny-bslib skill for layouts and components. When you ask for colors and styles, it also loads the shiny-bslib-theming skill. If you ask for a Quarto dashboard, it loads the quarto-authoring skill.
For a Python dashboard, such as Shiny for Python or Streamlit, Posit Assistant writes the code without a built-in skill.
Guide
Step 1. Know Your Data
Before you design the dashboard, make sure that you know which variables to show. If you do not know the data well, first explore your data.
Step 2. Describe Your Dashboard
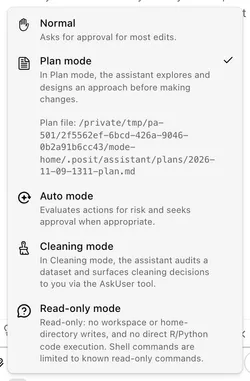
For a large dashboard with many pages, type /plan first, or select Plan mode from the mode picker. In Plan mode, Posit Assistant writes a plan for you to approve before it writes the code.
Next, tell Posit Assistant what the dashboard must show. Include the data, the plots, and the inputs:
Build a dashboard that shows employee salary distributions by department, with filters for work status.
Refer to specific columns or variables from your data. Posit Assistant can examine your data in your session, so it uses the correct names.
Step 3. Review the First Version
Posit Assistant makes a complete dashboard, with inputs, summary values, and plots. Run or render the dashboard. Then examine each panel and input.
Step 4. Change the Design
Ask for changes, one area at a time. For example:
- Change the bar chart to a box plot.
- Add a panel that shows salary over time.
- Put the filters in a sidebar.
- Use a dark theme. or Use our brand colors.
Get the layout and the panels correct first. Then refine the details in follow-up messages.
Step 5. Deploy the Dashboard
When the dashboard is complete, ask Posit Assistant to help you deploy it to Connect or Posit Connect Cloud:
Help me deploy this dashboard to Connect Cloud.
Next Steps
- To fix an error in your dashboard, see Debug & Fix Code.
- For more about skills, see Skills.