Explore Your Data
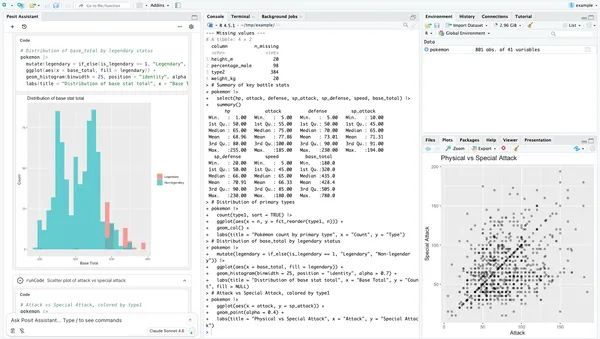
Posit Assistant can help you do exploratory data analysis (EDA). You ask questions about a dataset in plain language, and Posit Assistant writes and runs the code, then shows you the results.
This guide walks you through using Posit Assistant for EDA. By the end of this guide, you will have:
- A clean dataset and a reusable cleaning script
- Summaries, patterns, and plots that answer your questions
- A Quarto report or a Jupyter notebook that records your analysis
Prerequisites
- Posit Assistant installed with a model provider connected
- A dataset that R or Python can read (for example, a CSV file)
- Quarto installed
Guide
Step 1. Load Your Data
Load the dataset in your R or Python session. Or, ask Posit Assistant to load it:
Load
data/salaries.csvand show me its structure.
Step 2. Clean Your Data
If the data has problems, such as wrong types, duplicates, or data-entry errors, clean it before you explore it.
-
Type
/clean, select Cleaning mode from the mode picker, or ask Posit Assistant to clean your data.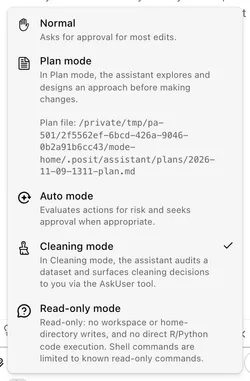
-
Answer each question that Posit Assistant asks. It shows the evidence and usually recommends an option.
-
Tell Posit Assistant where to save the cleaning script.
When the script is saved, Posit Assistant exits Cleaning mode. To exit before then, type /normal.
Step 3. Ask Questions
In plain language, ask questions about your data or ask Posit Assistant to make plots. For example:
- What does this data look like?
- Show me the relationship between years of experience and salary.
- Compare the median salary by department.
- Which columns have missing values?
- Are there clusters or outliers in salary?
- Make a publication-ready ggplot2 plot of salary by department, with a title and axis labels.
Specific questions give better results. Show me a histogram works, but Show me the distribution of salary by department, with median lines gives you better analysis.
Step 4. Follow Up on the Results
Ask follow-up questions to refine your analysis. For example, request a different chart type, filter a subset, or examine one variable in more detail.
To get ideas, ask: What patterns should I look at next? Posit Assistant shows suggested next steps with a sparkle icon. When you click a suggestion, Posit Assistant puts its text in the chat input. You can edit the text before you send it.
Suggestions are only suggestions. The purpose of EDA is to help you understand your data. Read each result, and decide which direction to explore next.
Step 5. Track Your Progress (Positron Only)
In Positron, type /eda-log to open the EDA log in an editor tab. The log lists each area that you explored, its status, and its key findings. It also gives suggestions for what to explore next.
Posit Assistant updates the log as your analysis continues. To update it immediately, click Refresh in the log.
Step 6. Save Your Results
Save your findings to a document so that you can share your analysis with your team or find it again later:
- To create a Quarto document (
.qmd), type/report. - To create a Jupyter notebook (
.ipynb) in Positron, type/notebook.
You can add instructions after the command, for example: /report Include only the salary analysis.
If Posit Assistant does not know how to load your data, it asks you. Before it writes the document, it proposes an outline for you to review.
You do not need to wait until the end of your analysis. Use the chat to iterate on your analysis, and move important results into the report when you find them by asking Posit Assistant to include them.
Next Steps
- To make an interactive application from your analysis, see Build a Dashboard.
- For more about the commands in this guide, see Commands.